Sidebar Overview
This knowledge article provides an overview of each title listed down the left hand green bar column.
When you’re logged into the system, you’ll see the green left-hand bar. This is your main navigation menu — it’s how you move around the platform.
The menu gives you quick access to the major sections you’ll use often: for example Bid Analysis, Dashboard, Bid Library, Organisation, and Help & Support.
Click any section name to open that part of the system in the main area on the right.
In the next part we’ll walk through each menu item in turn: what it does, when you’ll use it, and what to expect.
Bid analysis
What you’ll see on this page
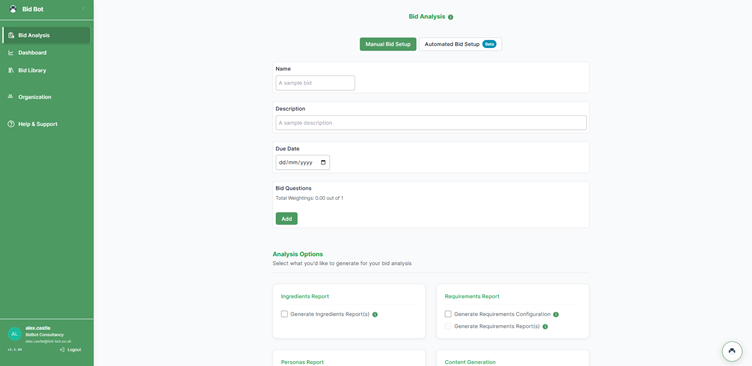
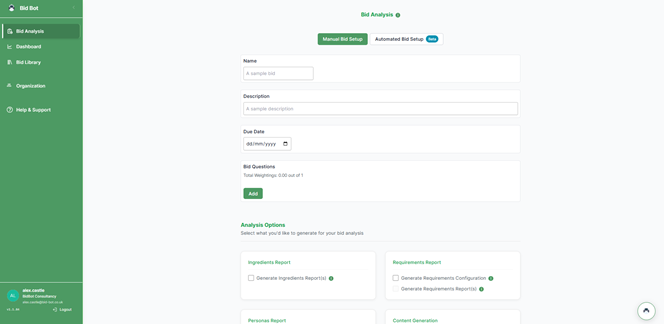
By clicking on “Bid Analysis” — this is where you start to set up a bid you want to analyse. See image below.
Data dashboard
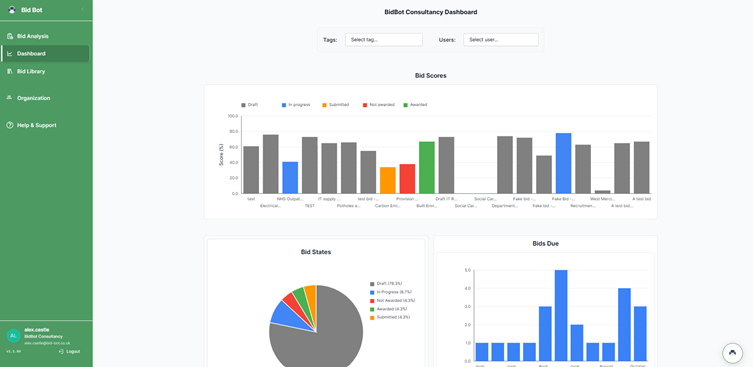
By clicking on the “dashboard” you will see the following.
What you’ll see
- A large area showing charts and graphs about your past bids: for example Bid Scores (how each bid performed), Bid States (draft / in-progress / submitted / awarded / not awarded) and Bids Due (how many bids are approaching deadline).
- Filters at the top so you can select by Tags or by Users to focus on certain categories or team members.
- The left-hand navigation bar remains visible (so you can switch sections) but this page is all about reviewing data.
Why this page is useful
- It helps you understand your performance: See which bids got high scores and which didn’t, so you can identify strengths.
- You can spot improvement opportunities: If many bids ended up as “Not awarded”, you can ask why and adjust.
- You can check trends: For example, if bid scores are rising or falling over time, or certain tags (types of bids) consistently perform better or worse.
- It helps you manage workload and deadlines: By looking at “Bids Due” you see which upcoming bids need attention.
Bid Library
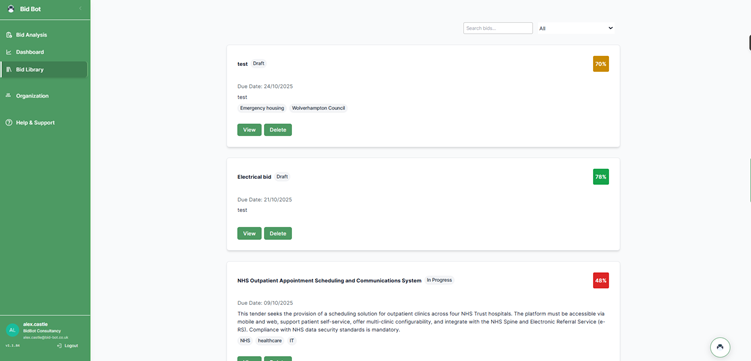
What you’ll see
- A list of past and current bid entries in a clear “card” or row format. Each entry will usually show:
- The bid name/title.
- Status (for example: Draft, In Progress).
- The due date.
- A score or percentage showing how the bid performed or where it stands.
- Buttons like View (to open the full bid) or Delete.
- A search box and filters (e.g., by tag or status) so you can easily find a specific bid.
Why this page is useful
- It serves as the central archive of all your bids — you can go back and review previous work, which helps with learning and improvement.
- It gives you a quick snapshot of what’s upcoming (due dates) and how past bids scored — this helps with planning and identifying which bids need attention.
- It enables you to view details of each bid quickly (by clicking View), so you can see full content, follow-up tasks, or edit if needed.
- It supports filtering and searching — so when you have many bids, you can find a specific one easily (for example by tag, date, or status).
Organisation page
Welcome to the “Organisation” section of the platform. Here’s what you’ll find, and why it matters — written simply for ease of use.
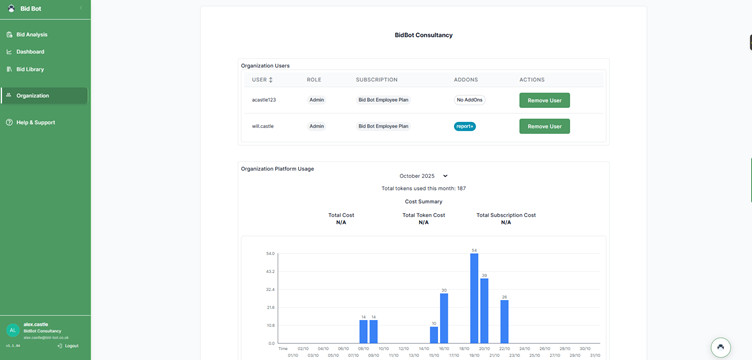
What you’ll see on this page
- A table listing Organization Users — showing each user’s name/email, their Role (for example, Admin), the Subscription plan they have, and any Add-Ons.
- Below or alongside that, a section showing Organisation Platform Usage — often with a bar graph or chart that indicates things like “Total tokens used this month”, usage by date, etc.
- Buttons or actions such as Remove User in the user list.
What it is and what to do
- This page is where you (or your administrator) manage who has access to the system under your organisation’s account.
- Check the list of users to make sure everyone is authorised and has the correct role (Admin, User, etc).
- If someone leaves or should no longer have access, you can remove them using “Remove User”.
- The usage graph is for internal monitoring — it shows how many “tokens” the system has used (our work-units behind the scenes).
- Important: For you as the user, that usage number does not affect your access, cost or how you use the platform.
- So if you see a number like “187 tokens used this month”, you can safely ignore it — it’s just to help us monitor behind the scenes.
- Use this page occasionally to:
- Verify the list of users is up-to-date.
- Ensure that the roles and subscriptions are correct for each person.
- Note that you don’t need to worry about the “token usage” chart — it’s visible, but does not require any action from you.
Guides
By selecting guides, it will take you to our knowledge library here, where you will be able to find training guides to help you on your journey. If you are still stuck, please reach out through our message chat and you will be able to receive a 15 min initial meeting with a bid expert or tech expert depending on the issue.