Have a Question?
Understanding Your Bid Performance
Overview
The Dashboard shows you how your bids are performing. Use it to see trends, identify areas for improvement, and make better decisions about your bids.
Getting Started
- Go to Dashboard from the sidebar
- You’ll see charts and metrics showing your bid performance
Overview Analytics
Key Metrics
The overview section shows:
- Total Bids: Total number of bids in your library
- Average Score: Average bid score across all bids
- Active States: Breakdown of bids by status
- Bids Per Month: Trend of bid creation over time
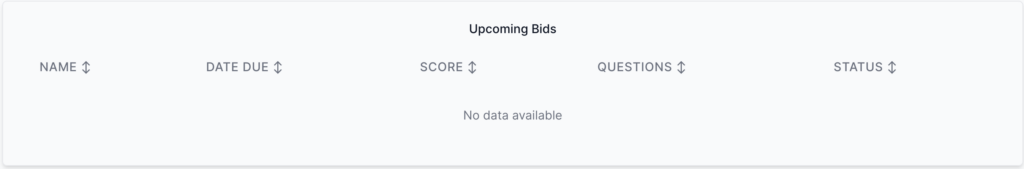
- Upcoming bids: a table of the upcoming bids and details about them
- Top Categories: Most common analysis categories
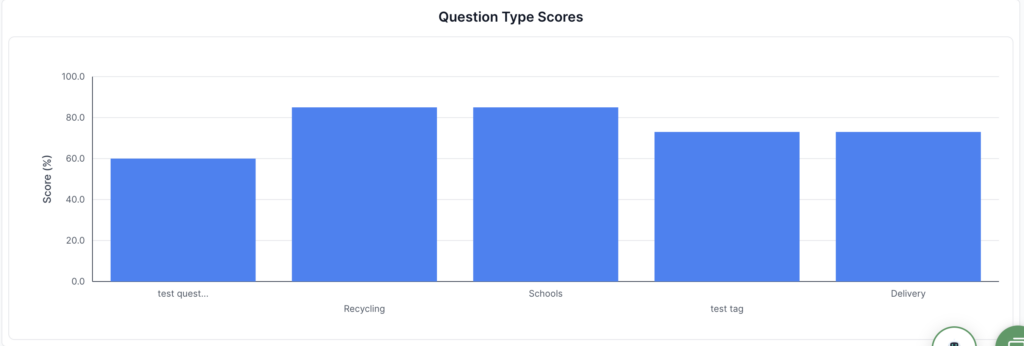
- Bid question types: compare against different types of questions you regularly get to see where you need to improve
Filters
Apply filters to focus on specific data:
Tags
- Select tags to filter by bid categories
- View analytics for specific bid types or projects
User Filter
- If in an organisation, filter by team member
- Analyse individual or team performance
Charts and Visualisations
Bid Scores
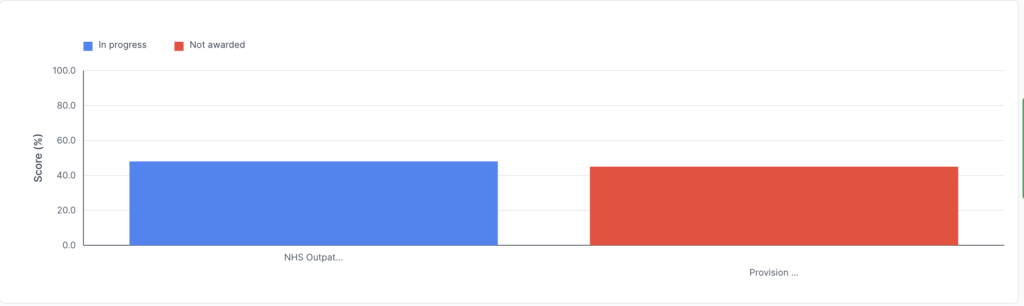
Average Bid Score

Upcoming Bids
Top Chart Data
- Visual representation of top-performing categories
- Shows Ingredients, Personas, Requirements performance
- Colour-coded for easy identification
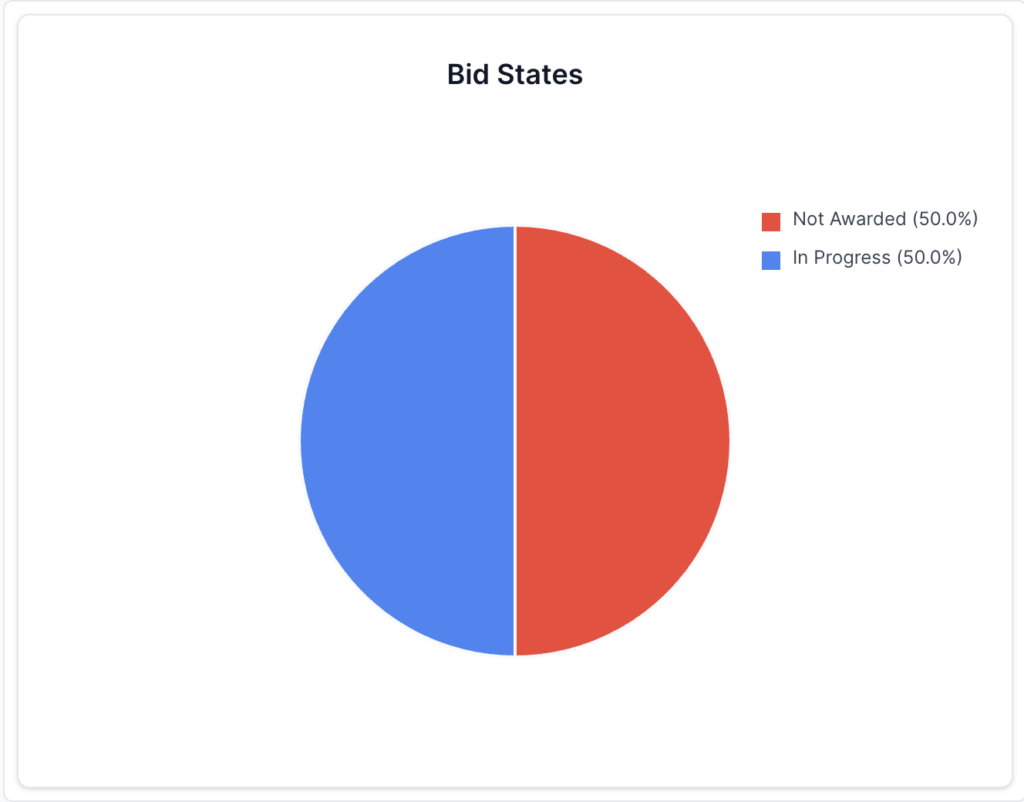
Active States Pie Chart
- Breakdown of bids by status
- Visual representation of bid lifecycle stages
- Shows distribution across Draft, In Progress, Submitted, Awarded, and Not Awarded
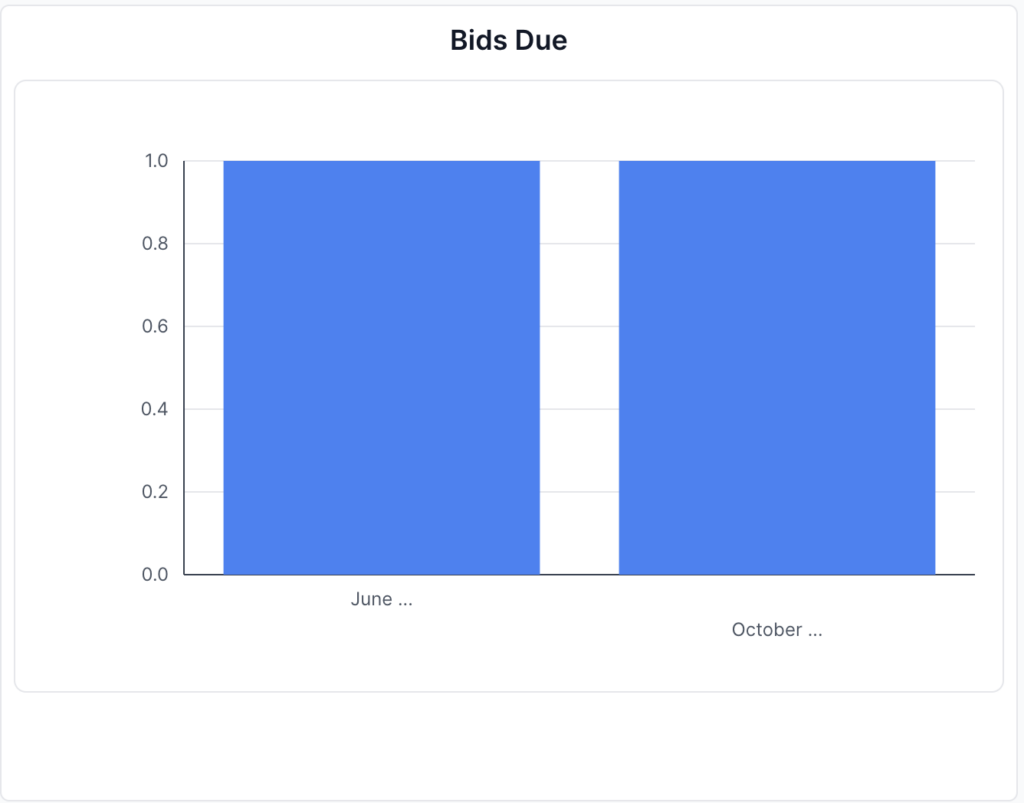
Bids Per Month Chart
- Trend line of bid creation
- Shows bid activity over time
- Helps identify busy periods
Detailed Analytics Sections
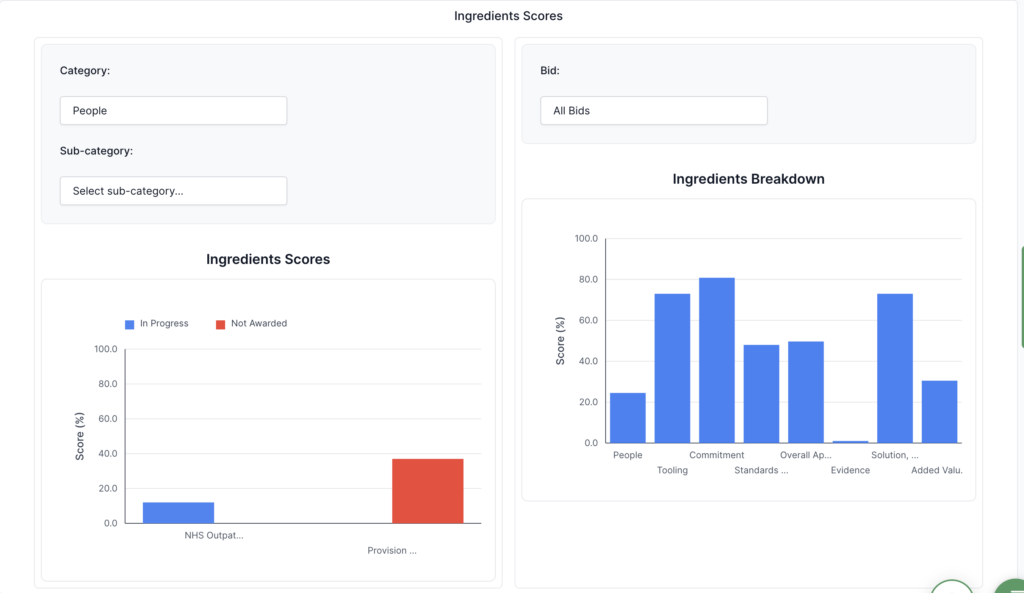
Ingredients Analytics
Analyse bid performance by ingredients:
- Apply Filters: Use tag, user, category, subcategory, or bid filters
- View Metrics: See ingredients coverage and scores
- Identify Gaps: Find missing or weak ingredients
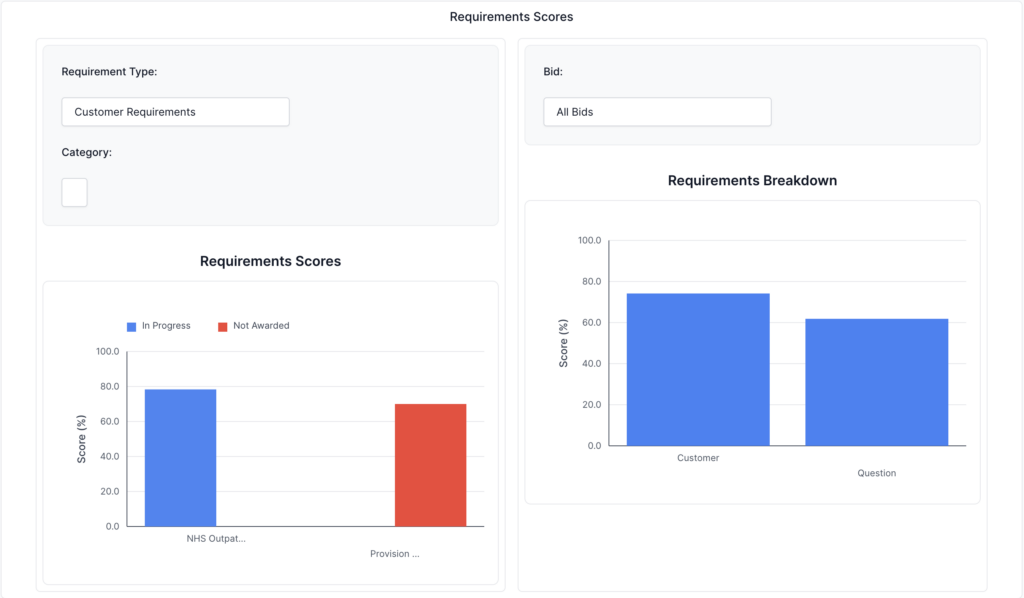
Requirements Analytics
Analyse requirements coverage:
- Filter Requirements: Select specific requirement types
- Customer Requirements
- Question Requirements
- View Coverage: See requirements coverage metrics
- Score Analysis: Analyse requirements scoring
- Improvement Areas: Identify requirements gaps
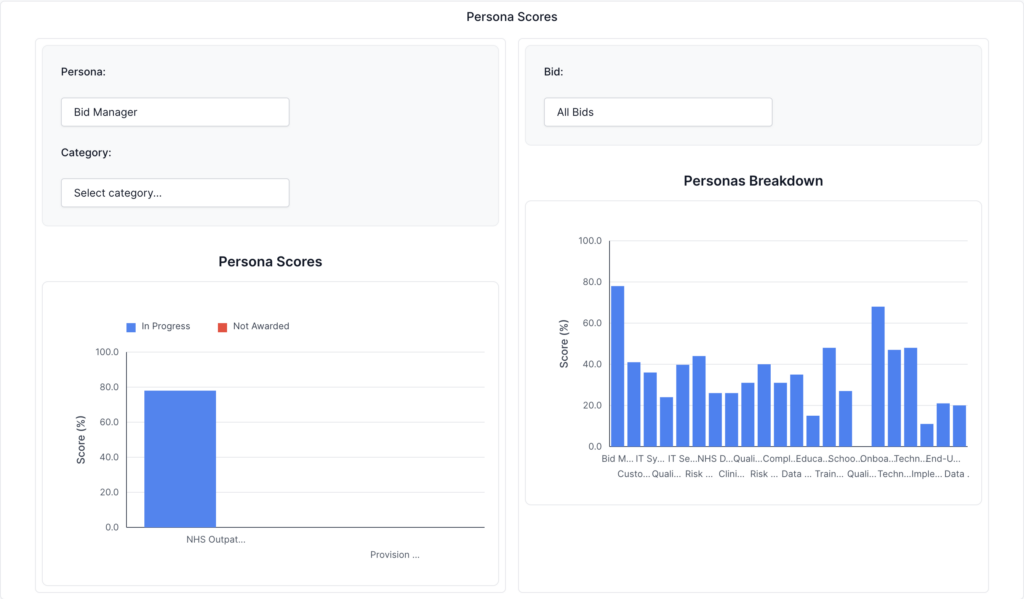
Personas Analytics
Analyse stakeholder persona alignment:
- Select Personas: Choose specific personas to analyse
- View Scores: See persona-weighted scores
- Persona Breakdown: Individual persona performance
- Alignment Analysis: How well do bids align with personas
Marking Scheme Analytics
Analyse marking scheme performance:
- Select Marking Scheme: Choose marking scheme rules
- View Scores: See marking scheme scores
- Criteria Analysis: Performance by marking criteria
- Score Distribution: Distribution of marking scores
Bid Question Type Analytics
Using Filters Effectively
Tag Filtering
- Project Types: Filter by project category
- Customers: Filter by customer tags
- Outcomes: Filter by Won/Lost tags
- Combinations: Combine multiple tag filters
User Filtering (Organisations)
- Individual Performance: Analyse individual team member performance
- Team Comparison: Compare team members
- Collaboration: Understand collaboration patterns
Bid Selection
- Specific Bids: Analyse particular bid sets
- Comparison: Compare specific bids
- Subset Analysis: Focus on bid subsets
Best Practices
Regular Review
- Weekly Reviews: Check the dashboard weekly
- Monthly Analysis: Deep dive monthly
- Quarterly Planning: Use for quarterly planning
- Trend Monitoring: Watch for trends over time
Filter Usage
- Start Broad: Begin with all data
- Narrow Down: Apply filters to focus
- Compare Periods: Compare different time periods
- Segment Analysis: Analyse by tags, users, etc.
Action Planning
- Identify Weaknesses: Use analytics to find gaps
- Prioritise Improvements: Focus on high-impact areas
- Track Progress: Monitor improvements over time
- Share Insights: Share dashboard insights with the team
Troubleshooting
No Data Showing
- Check Filters: Ensure filters aren’t too restrictive
- Verify Bids: Confirm bids exist in the library
- Date Range: Check date range includes bid data
- Refresh: Refresh the page to reload data
Charts Not Loading
- Internet Connection: Verify a stable connection
- Browser: Try a different browser
- Wait: Allow time for charts to render
- Refresh: Reload page if needed
Filters Not Working
- Clear Filters: Reset all filters
- One at a Time: Apply filters individually
- Check Values: Verify filter values are correct
- Refresh: Reload if filters seem stuck
Analytics Seem Incorrect
- Data Range: Verify date range includes all relevant data
- Filters: Check filters aren’t excluding data
- Bid Status: Ensure bids have the correct status
- Reports: Verify reports have been generated for bids
Performance Issues
- Reduce Date Range: Narrow date range if slow
- Fewer Filters: Apply fewer filters at once
- Wait: Allow time for analytics to compute
- Contact Support: If performance is consistently poor